Salt levels may be one of the biggest water quality threats the otherwise pristine surface waters in this watershed face as time progresses. Sodium and chloride are the most important parameters of the anion/cation data to monitor as development and population increase in this area (see Appendix 5). Increasing regional salinity is having a negative impact on water quality. Studies in the past have shown that organisms cannot process organic matter and other detritus as effectively with increased salinity in the water. Ecosystem functionality is negatively affected, and high amounts of these ions can be toxic to fish and insects. More salt on the roads for controlling ice and snow leads to more salt running off and entering surface and groundwater resources when washed away by the rain or snowmelt. As the numbers increase each year, it is important to note the bigger picture trends going on with road salt and increasing salinity in freshwater systems.
Across America as a whole, streams and rivers are becoming saltier with a big reason being the deicing of roads. A study conducted by the National Science Foundation (NSF) looked at changing salt levels in over 232 data monitoring sites across the country over the past 50 years. The data showed that there have been significant increases in salinization in waterways. About 37% of all the drainage area in the United States experienced a significant increase in salt concentrations. Below is a figure that shows these changes regionally in the United States.
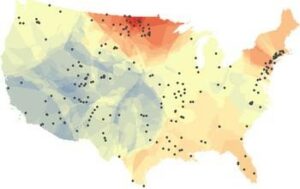
Figure 1: Map from NSF freshwater salinization study. Warm colors show increasing salinity; cool colors show decreasing salinity.
With the exception of a few states in the north-central part of the country, New England is the region where salinity increases are seen the most dramatically (Figure 1). It is evident that road salt applied to maintain roadways in the winter is the main cause of these increased concentrations in streams. According to the NSF report, many northeastern cities and states have outdated salt spreading equipment that needs to be upgraded, leading to salt spreading problems as well. Roadways are not the only issue either. Even the small amount of salts used to melt ice in parking lots, driveways, and on sidewalks can contribute to a much larger contamination problem.2
In NH, studies show that the amount of salt going into NH’s streams has been increasing since the 1960’s and the high amount of salt being used on roads has created an expectation among drivers to see wet, black pavement during snow storms. Putting this into context, it is not surprising that the Ossipee Watershed is facing similar issues with its streams and rivers.
The interactive map below shows sites (red dots) where the community science program RIVERS (Regional Interstate Volunteers for the Ecosystems and Rivers of Saco) has collected salinity data. When clicking on a site, a map showing the median conductivity value for each year appears. At 85% of the sites, a significant increase in salinity has been noted by Mann-Kendall analysis. A simple linear regression line (blue) has been added to the graphs to aid in overall trend observation.
For more information on the RIVERS program, please visit gmcg.org/research/citizen-science/.